Sticker Shock: Assessing the Real Cost of Gas


Have you experienced sticker shock at the pump recently? Chances are, you probably noticed a price hike the last time you topped off your tank. According to the Energy Information Administration, the price of conventional gasoline has risen 57 percent in the past year, and consumers are feeling the squeeze.
So, how bad is it? The headlines are telling us that gas prices have never been higher. But is this the most we’ve ever paid for gasoline at the pump? Technically, yes, but there’s more to the story.
Nominal Vs. Real Prices
The headlines and fears about all-time highs in gasoline prices are playing into an economic theory called money illusion, which is the tendency for consumers to view their wealth (and prices) in nominal terms rather than real terms. To think in real terms, it’s important to understand that the purchasing power of a dollar in March 2022 is not the same as it was in March 1992. Prices rise over time, so the value of a single dollar will decline over time as it buys fewer goods and services, all else equal.
Let’s walk through an example to illustrate what I mean. Let’s say your income in 1992 was $10,000 per year and the cost to buy a used car was $5,000. Over the next 30 years, both your income and the price of cars increase; in 2022, they are $50,000 and $25,000, respectively. In relation to your income, the cost of a car today is the same as it was in 1992 (one-half income). In real dollar terms, the cost to you has remained the same over the entire period, even though the sticker price of the car has increased over those 30 years. On the other hand, if your income had only increased to $40,000, the cost of the vehicle would’ve increased in real dollar terms because it would require a larger portion of your income.
Budgeting for Gas
Let’s apply the same logic to the cost of gasoline in today’s environment. Currently, the average price of conventional gasoline is about $3.50 per gallon. (This value most likely differs from what you see at the pump because it excludes state tax.) While $3.50 is a sticker shock, what should matter most as a consumer is how the price per gallon relates to income and how that compares to previous periods. That view offers a truer measure of the price in the context of purchasing power of the dollar, similar to the example above.
For a 20-gallon vehicle that requires a single fill per week, consumers need to set a weekly budget of $70 in today’s environment. Relative to the average American’s weekly income, $70 equates to about 6 percent of pay. In March 2012, the price of gas was $0.50 lower, and the cost to fill a 20-gallon tank was $60 instead of $70; however, incomes 10 years ago were also lower. In order to make a true assessment of where things stand today, we need to understand the ratio of gasoline prices to incomes over time. The results are shown in the chart below, which displays the weekly cost of gasoline relative to weekly income.
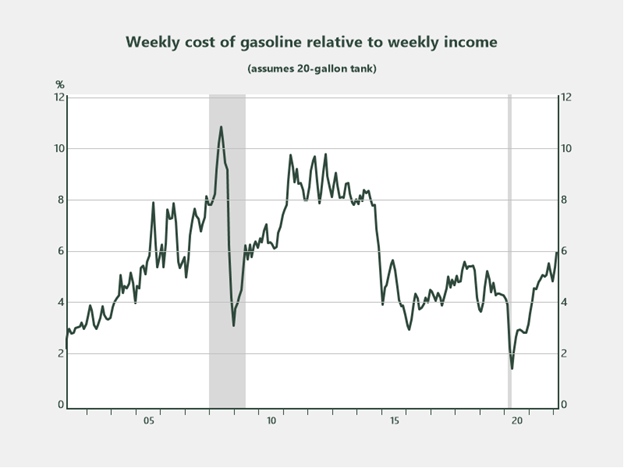
Source: Haver/Commonwealth Financial Network
It turns out that consumers needed to set aside a larger portion of their weekly wages to fill a tank of gas in 2012 than they do today (assuming mileage driven is the same). Ten years ago, consumers had to set aside a budget of almost 10 percent of weekly pay, while today it’s only 6 percent. It may feel like a tank fill-up is taking a larger bite out of budgets than ever before (as the headlines suggest), but the reality is we’re right around the 20-year average of gasoline prices relative to incomes.
More Mileage for the Buck
Another thing to consider is that most vehicles driven today are more fuel-efficient than they were a decade ago. So, chances are you’re requiring fewer fill-ups per month than you did in 2012. The chart below shows the average fuel economy of light-duty vehicles over time, with a 29 percent improvement in the period 2005–2020. As vehicles become more fuel-efficient, Americans are making fewer trips to the pump, and that means less money spent on gas over time even as prices rise.
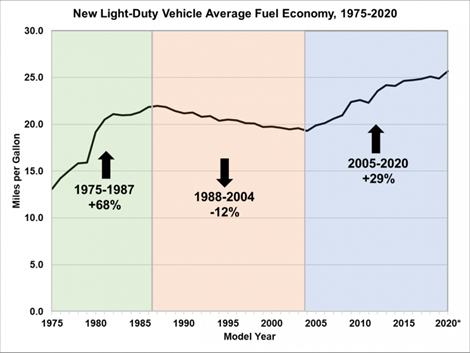
Source: energy.gov
Looking Beyond the Headlines
Our job as analysts is to help readers understand the numbers, which often includes looking beyond the headlines. In this case, it’s important to understand that while gas prices have increased recently, we’re not too far off from where we’ve been historically as it relates to budgets and the real cost of gasoline. Part of the reason we’re getting sticker shock these days is that we’ve gotten accustomed to paying very low prices in recent years. For the average American, the percentage of wages required to fill a 20-gallon tank of gas hit an all-time low of less than 2 percent in the depths of the pandemic. Now that prices have risen so dramatically in such a short period of time, it feels like things have never been higher.
In closing, I’d like to stress that the information presented is in no way an attempt to diminish the very real situation many households are experiencing in today’s inflationary environment. The numbers used are based on averages. As we know, averages do not offer perspective on every situation. There are many households out there on fixed incomes that have not experienced a pay increase in the past decade to help offset the price increase in other goods and services. Also, there are individuals who have not had the luxury of trading up for a more fuel-efficient vehicle in the past 10 years. Those situations are very real. Our hope is that inflation reverts to a more reasonable level in the coming year to help ease the burden on those currently experiencing hardship.
Editor’s Note: The original version of this article appeared on the Independent Market Observer.

The information on this website is intended for informational/educational purposes only and should not be construed as investment advice, a solicitation, or a recommendation to buy or sell any security or investment product. Please contact your financial professional for more information specific to your situation.
Certain sections of this commentary contain forward-looking statements that are based on our reasonable expectations, estimates, projections, and assumptions. Forward-looking statements are not guarantees of future performance and involve certain risks and uncertainties, which are difficult to predict. Past performance is not indicative of future results. Diversification does not assure a profit or protect against loss in declining markets.
The S&P 500 Index is a broad-based measurement of changes in stock market conditions based on the average performance of 500 widely held common stocks. All indices are unmanaged and investors cannot invest directly into an index.
The MSCI EAFE (Europe, Australasia, Far East) Index is a free float‐adjusted market capitalization index that is designed to measure the equity market performance of developed markets, excluding the U.S. and Canada. The MSCI EAFE Index consists of 21 developed market country indices.
Third-party links are provided to you as a courtesy. We make no representation as to the completeness or accuracy of information provided at these websites. Information on such sites, including third-party links contained within, should not be construed as an endorsement or adoption by Commonwealth of any kind. You should consult with a financial advisor regarding your specific situation.
Please review our Terms of Use.